
- English
- Español
- Português
- русский
- Français
- 日本語
- Deutsch
- tiếng Việt
- Italiano
- Nederlands
- ภาษาไทย
- Polski
- 한국어
- Svenska
- magyar
- Malay
- বাংলা ভাষার
- Dansk
- Suomi
- हिन्दी
- Pilipino
- Türkçe
- Gaeilge
- العربية
- Indonesia
- Norsk
- تمل
- český
- ελληνικά
- український
- Javanese
- فارسی
- தமிழ்
- తెలుగు
- नेपाली
- Burmese
- български
- ລາວ
- Latine
- Қазақша
- Euskal
- Azərbaycan
- Slovenský jazyk
- Македонски
- Lietuvos
- Eesti Keel
- Română
- Slovenski
- मराठी
- Srpski језик
The Study on the Distribution of Electrical Resistivity in n-Type 4H-SiC Crystals
2024-09-20
4H-SiC, as a third-generation semiconductor material, is renowned for its wide bandgap, high thermal conductivity, and excellent chemical and thermal stability, making it highly valuable in high-power and high-frequency applications. However, the key factor affecting the performance of these devices lies in the distribution of electrical resistivity within the 4H-SiC crystal, especially in large-sized crystals where uniform resistivity is a pressing issue during crystal growth. Nitrogen doping is used to adjust the resistivity of n-type 4H-SiC, but due to the complex radial thermal gradient and crystal growth patterns, the resistivity distribution often becomes uneven.
How Was the Experiment Conducted?
The experiment utilized the Physical Vapor Transport (PVT) method to grow n-type 4H-SiC crystals with a diameter of 150 mm. By adjusting the mixture ratio of nitrogen and argon gases, the concentration of nitrogen doping was controlled. The specific experimental steps included:
Maintaining the crystal growth temperature between 2100°C and 2300°C and the growth pressure at 2 mbar.
Adjusting the volumetric fraction of nitrogen gas from an initial 9% down to 6% and then back up to 9% during the experiment.
Cutting the grown crystal into wafers approximately 0.45 mm thick for resistivity measurement and Raman spectroscopy analysis.
Using COMSOL software to simulate the thermal field during crystal growth to better understand the resistivity distribution.
What Did the Research Involve?
This study involved growing n-type 4H-SiC crystals with a diameter of 150 mm using the PVT method and measuring and analyzing the resistivity distribution at different growth stages. The results showed that the resistivity of the crystal is influenced by the radial thermal gradient and the crystal growth mechanism, exhibiting different characteristics at different growth stages.
What Happens During the Early Stage of Crystal Growth?
In the initial phase of crystal growth, the radial thermal gradient most significantly affects the resistivity distribution. The resistivity is lower in the central region of the crystal and gradually increases towards the edges, due to a larger thermal gradient causing a decrease in nitrogen doping concentration from the center to the outskirts. This stage’s nitrogen doping is primarily influenced by the temperature gradient, with carrier concentration distribution showing clear characteristics depending on temperature variations. Raman spectroscopy measurements confirmed that the carrier concentration is higher at the center and lower at the edges, corresponding with the resistivity distribution results.
What Changes Occur in the Mid-Stage of Crystal Growth?
As crystal growth progresses, the growth facets expand, and the radial thermal gradient decreases. During this stage, although the radial thermal gradient still affects resistivity distribution, the influence of the spiral growth mechanism on the crystal facets becomes apparent. The resistivity is notably lower in the facet regions compared to the non-facet regions. Raman spectroscopy analysis of wafer 23 showed that the carrier concentration is significantly higher in the facet regions, indicating that the spiral growth mechanism promotes increased nitrogen doping, resulting in lower resistivity in these regions.
What Are the Characteristics of the Late Stage of Crystal Growth?
In the later stages of crystal growth, the spiral growth mechanism on the facets becomes dominant, further reducing the resistivity in the facet regions and increasing the resistivity difference with the crystal center. Analysis of wafer 44’s resistivity distribution revealed that the resistivity in the facet regions is significantly lower, corresponding to higher nitrogen doping in these areas. The results indicated that with increasing crystal thickness, the influence of the spiral growth mechanism on carrier concentration surpasses that of the radial thermal gradient. The nitrogen doping concentration is relatively uniform in the non-facet regions but significantly higher in the facet regions, indicating that the doping mechanism in facet regions governs carrier concentration and resistivity distribution in the late growth stage.
How Are Temperature Gradient and Nitrogen Doping Related?
The experiment results also showed a clear positive correlation between nitrogen doping concentration and the temperature gradient. In the early stage, nitrogen doping concentration is higher in the center and lower in the facet regions. As the crystal grows, nitrogen doping concentration in the facet regions gradually increases, eventually surpassing that in the center, leading to the resistivity differences. This phenomenon can be optimized by controlling the nitrogen gas volumetric fraction. Numerical simulation analysis revealed that the reduction in radial thermal gradient leads to a more uniform nitrogen doping concentration, especially evident in the later growth stages. The experiment identified a critical temperature gradient (ΔT) below which the resistivity distribution tends to become uniform.
What Is the Mechanism of Nitrogen Doping?
Nitrogen doping concentration is influenced not only by temperature and radial thermal gradient but also by the C/Si ratio, nitrogen gas volumetric fraction, and growth rate. In non-facet regions, nitrogen doping is mainly controlled by temperature and C/Si ratio, while in facet regions, the nitrogen gas volumetric fraction plays a more crucial role. The study showed that by adjusting the nitrogen gas volumetric fraction in the facet regions, resistivity can be effectively reduced, achieving higher carrier concentration.

Figure 1(a) depicts the positions of the selected wafers, representing different growth stages of the crystal. Wafer No.1 represents the early stage, No.23 the mid-stage, and No.44 the late stage. By analyzing these wafers, researchers can compare the resistivity distribution changes at different growth stages.
Figures 1(b), 1©, and 1(d) respectively show the resistivity distribution maps of wafers No.1, No.23, and No.44, where color intensity indicates resistivity levels, with darker regions representing facet positions with lower resistivity.
Wafer No.1: The growth facets are small and located at the edge of the wafer, with overall high resistivity that increases from the center to the edge.
Wafer No.23: The facets have expanded and are closer to the wafer center, with significantly lower resistivity in the facet regions and higher resistivity in the non-facet regions.
Wafer No.44: The facets continue to expand and move towards the wafer center, with resistivity in the facet regions markedly lower than in other areas.

Figure 2(a) shows the width variation of the growth facets along the crystal diameter direction ([1120] direction) over time. The facets expand from narrower regions in the early growth stage to wider areas in the later stage.
Figures 2(b), 2©, and 2(d) display the resistivity distribution along the diameter direction for wafers No.1, No.23, and No.44, respectively.
Wafer No.1: The influence of the growth facets is minimal, with resistivity gradually increasing from center to edge.
Wafer No.23: The facets significantly lower the resistivity, while the non-facet regions maintain higher resistivity levels.
Wafer No.44: The facet regions have significantly lower resistivity than the rest of the wafer, with the facet effect on resistivity becoming more pronounced.
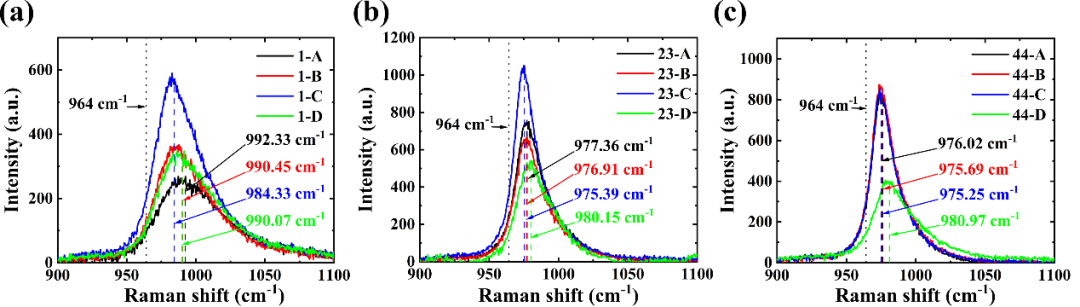
Figures 3(a), 3(b), and 3© respectively show the Raman shifts of the LOPC mode measured at different positions (A, B, C, D) on wafers No.1, No.23, and No.44, reflecting changes in carrier concentration.
Wafer No.1: The Raman shift decreases gradually from the center (Point A) to the edge (Point C), indicating a reduction in nitrogen doping concentration from center to edge. No significant Raman shift change is observed at Point D (facet region).
Wafers No.23 and No.44: The Raman shift is higher in the facet regions (Point D), indicating higher nitrogen doping concentration, consistent with the low resistivity measurements.

Figure 4(a) shows the variation in carrier concentration and radial temperature gradient at different radial positions of the wafers. It indicates that carrier concentration decreases from center to edge, while the temperature gradient is larger in the early growth stage and decreases subsequently.
Figure 4(b) illustrates the change in the difference in carrier concentration between the facet center and wafer center with the temperature gradient (ΔT). In the early growth stage (Wafer No.1), the carrier concentration is higher at the wafer center than at the facet center. As the crystal grows, nitrogen doping concentration in the facet regions gradually surpasses that in the center, with Δn changing from negative to positive, indicating the growing dominance of the facet growth mechanism.

Figure 5 shows the change in resistivity at the wafer center and facet center over time. As the crystal grows, the resistivity at the wafer center increases from 15.5 mΩ·cm to 23.7 mΩ·cm, while the resistivity at the facet center increases initially to 22.1 mΩ·cm and then decreases to 19.5 mΩ·cm. The decline in resistivity in the facet regions correlates with changes in nitrogen gas volumetric fraction, indicating a negative correlation between nitrogen doping concentration and resistivity.
Conclusions
The key conclusions of the study are that the radial thermal gradient and crystal facet growth significantly impact the resistivity distribution in 4H-SiC crystals:
In the early stage of crystal growth, the radial thermal gradient determines the carrier concentration distribution, with lower resistivity at the crystal center and higher at the edges.
As the crystal grows, nitrogen doping concentration increases in the facet regions, lowering resistivity, with the resistivity difference between facet regions and crystal center becoming more apparent.
A critical temperature gradient was identified, marking the transition of resistivity distribution control from the radial thermal gradient to the facet growth mechanism.**
Original Source: Xie, X., Kong, Y., Xu, L., Yang, D., & Pi, X. (2024). Distribution of the electrical resistivity of a n-type 4H-SiC crystal. Journal of Crystal Growth. https://doi.org/10.1016/j.jcrysgro.2024.127892